Upscaling your well log
With the Upscale Well Log form (model > Rock Properties > Upscale Well Log or model > Facies > Upscale Well Log) you can upscale both discrete ('facies') and continuous ('rock properties') well logs to the resolution of your grid. Well log data is normally at a higher vertical resolution than the resolution of the cells in the 3D grid. Upscaling translates the higher resolution well log data to lower resolution grid cell values. A rock property log can (optionally) be biased to a facies log, to enforce consistency between the upscaled facies cells and their corresponding rock properties. The output of the upscaling is an upscaled grid property with upscaled data in the 3D grid cells that are penetrated by the well trajectories (i.e. the Blocked wells item in the JewelExplorer). All other 3D grid cells are as yet undefined.
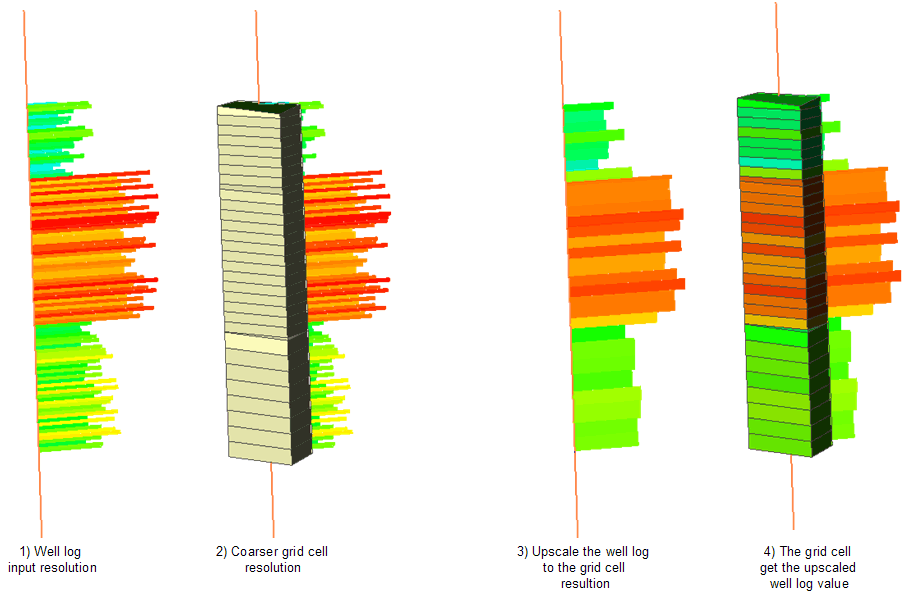
The principle of well log upscaling. click to enlarge
On the form, you can select which wells you want to include, the upscaling method and whether you want to bias your rock property log to a facies log, in which case you need to have an upscaled facies log available in your grid. The result is an upscaled grid property, which will be stored in the Properties > Upscaled Properties folder of your grid in the JewelExplorer.
You can visualize the upscaled property in the 3D View as a property of your Blocked wells (Blocked wells are automatically created during upscaling) or directly on your grid. You can also display your upscaled property in the Well View by selecting 'Add continuous grid property' or 'Add discrete grid property' as the log type. You can find the upscaled grid property in the property drop-down list as 'Upscaled Properties\ <name of the upscaled property>'.
To upscale your well log
- At the top of the form, select the Grid to which you want to upscale the log.
- Under Upscaled property, select Create new and type the name in the field below.
- (Optional)
 Autofill upscaled well log setting With this option you can derive the upscaling settings of an existing 'well log upscaling case' from another 3D grid.
 - Click on the icon to open the Autofill Upscaling Settings form.
- Grid Select the 3D grid that was used for the existing upscaled well log.
- Upscale well log Select the log that was used for the existing upscaled well log.
- Click Apply to derive the settings and keep the form open, or OK to derive the settings and close the form.
- In the Well log drop-down menu, first select the log type (left field). The field on the right filters all logs in your solution based on the selected log type. Select the log you want to upscale. The selected log will be upscaled to the cell resolution of the selected grid. You can also select an upscaled well log property that is created using the Property Tool.
- In the Wells section, check the boxes of the wells for which you want to upscale the selected log.
- In the Upscaling Settings section, set your preferred settings with the following options:
- Sum The upscaled value is the sum of the log values of the grid cell interval.
- Min The upscaled value is the minimum value of the log values of the grid cell interval.
- Max The upscaled value is the maximum value of the log values of the grid cell interval.
- Arithmetic mean The upscaled value is the arithmetic average (the sum of the log values divided by the number of log values) of the grid cell interval.
- Most occurring (Only available for discrete logs.) The upscaled value is the most occurring of all values in the grid cell interval.
- Nearest neighbor The upscaling value is the nearest value to the center of the upscaled grid cell interval.
- Geometric mean The upscaled value is the geometric average (the nth root of the product of n number of values) of the log values of the grid cell interval. This averaging method 'normalizes' the range of values, in the sense that it reduces the effect of exceptionally high or low values on the mean. All of the well log values inside the grid cell must be non-negative. If this is not the case, the upscaled value for the cell will be set to undefined. If there are any zero log values in the cell, the upscaled cell value will be zero.
- Harmonic mean This averaging method is often applied to data with log normal distributions, making it well suited for permeability which can exhibit several orders of magnitude difference between facies. All of the well log values inside the grid cell must be non-negative. If this is not the case, the upscaled value for the cell will be set to undefined. If there are any zero log values in the cell, the upscaled cell value will be zero.
- Root Mean Square The upscaled value is the square root of the arithmetic mean of the squares of the log values of the grid cell interval.
- Median The upscaled value is the median of the log values of the grid cell interval. The median is the value separating the higher half of the data sample, from the lower half. This averaging method reduces the importance of data outliers, for example caused by measurement errors.
- 1/3 Power average The upscaled value is a power mean where the exponent p=1/3. This method is recommended for properties with a logarithmic scale and extreme range, such as permeability in carbonates. All of the well log values inside the grid cell must be non-negative. If this is not the case, the upscaled value for the cell will be set to undefined.
- Global distribution reproduction Sample points are randomly picked from anywhere within the cell and the picked value is assigned as the upscaled value to the cell. Type a seed number (under Method Settings) if you want to exactly reproduce the results.
- K-layer averaging When a well penetrates more than one cell with identical k-layer ID, these 'neighboring' cells are averaged (upscaled) together and receive the same (upscaled) value.
- Zone averaging When a well penetrates more than one cell with identical zone ID, these 'neighboring' cells are averaged (upscaled) together and receive the same (upscaled) value.
- Single cell Each grid cell is upscaled individually.
- Depending on the type of log you selected for upscaling and the upscaling method, different settings are available in the Method Settings section:
- Weight by (only available when you are upscaling a continuous log in combination with method Arithmetic mean, Geometric mean, Harmonic mean, Root mean square or 1/3 Power average) From the Weight by drop-down menu, select another continuous log as weight. For example, you can use a net to gross log as a weight when upscaling a porosity log to calculate the average porosity in the net bulk volume.
- Undefined when all the weights are zero or undefined (default) The upscaled value of a cell will be undefined when all the weights of the log used for weighting are zero or undefined.
- Unweighted when all the weights are zero or undefined The upscaled value of a cell will be unweighted when all the weights in the log used for weighting are zero or undefined.
- Unweighted when <percentage> or more of the weights are zero or undefined Fill in a percentage. The upscaled value of a cell will be unweighted when the percentage of zero or undefined values in the log used for weighting is greater than or equal to the percentage you entered.
- Seed (only available when you are upscaling a continuous log in combination with method Global distribution reproduction) The seed number determines the starting point of the data sampling. You have two options:
- Click the dice to fill in a random seed number.
- Type a seed number in the field if you want to reproduce the results of the global distribution reproduction. If you manually typed the seed number, it will be stored with the upscaled well log.
- Proportion reproduction (only available when you are upscaling a discrete log)
- Weighted Type the weight (value between 0 and 10) that you want to apply to each class in the Weight column. For each facies class, the occurrence within each cell is multiplied by this value, and subsequently divided by the total of all weights within the cell. This way, you can allow a class to 'win' a cell, even when its fraction is low.
- Global Use this option when two (or more) facies are present in almost the same quantity and you want to prevent that one facies class is ignored. The higher you set the percentage, the more the original distribution of the facies classes is adhered to during upscaling.
- Click the dice to fill in a random seed number.
- Type a seed number in the field if you want to reproduce the results of the global distribution reproduction. If you manually typed the seed number, it will be stored with the upscaled property.
- With the Depth Alignment option you can choose to use markers or grid elements (zones or k-layers) to define the log interval to be used for upscaling. Marker depth alignment might be preferred in case the markers have a depth mismatch with the grid element tops and bases. To QC this mismatch with the 'Create All Residual Log Shift Logs' option, see Visualizing the residual log shift on how to do this. Note that when the grid is perfectly aligned with the markers, these two depth alignment options produce identical upscaling results.
- Marker depth alignment (default) The log interval between the markers is squeezed or stretched to align with the grid element, then upscaled to the grid element. When you are upscaling to k-layers (where markers only exist for the top of the shallowest and base of the deepest k-layer), this means the squeezed or stretched log interval is equally divided over the k-layers, before being upscaled to each k-layer.
- Grid depth alignment The log between the grid element (zone or k-layer) is upscaled directly to the grid element.
- Click OK to calculate and create the upscaled grid property and close the form. The upscaled grid property is added to the Upscaled Properties folder under your 3D Grid in the JewelExplorer.
To do this:
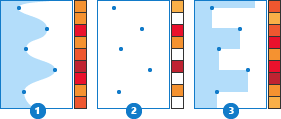
Schematic representation of the different 'Measurement type' settings for logs which impact the upscaling result (colored bars): 1) Local measurement with continuity, 2) Local measurement, 3) Boundary measurement. click to enlarge
Bias log Only available when you are upscaling a rock property log (i.e. a continuous log). When you check the box, you can select a (discrete) upscaled log to bias the upscaling calculations of your rock property log. Upon selection, all options except 'Method' and 'Weight by' get grayed-out and will be automatically set to match the settings of the selected (discrete) upscaled well log.
The bias log restricts the input values for the upscaling to only those intervals that coincide with the class of the upscaled bias log. This way you can, for example, eliminate the influence of thin layers (for example, thin shale layers) on the calculation of the upscaled log value. The upscaled class (of the bias log) is considered the most important class, and using the bias log can provide an upscaled log value that is more realistic and suitable for rock property modeling.
Upscale to The log is upscaled to either the K-layers or Zones of your selected grid. If you upscale to a zone that has more than one k-layer, all cells within that zone receive the same (upscaled) value.
Stratigraphic level Select the stratigraphic level that contains the zones to which you want to upscale (only available when you selected to upscale to Zones). The stratigraphic levels in the drop-down are the 'levels' as shown in the Model Definition View, which can be opened by clicking Show model definition view on the Upscaling & Layers form (model > 3D Grid). Note that in most cases, the levels in the Model Definition View are similar to the levels of the Stratigraphic View, however, the Model Definition View can potentially contain more levels as it allows for adding and duplicating levels. If a zone contains more than one K-layer, all cells within that zone receive the same (upscaled) value.
Method Select one of the following upscaling methods. Availability of methods depends on whether you are upscaling a discrete, or continuous log, and the log measurement type (local measurement, local measurement with continuity or boundary measurement):
Strategy Options vary depending on your selection under 'Upscale to':
Minimum data coverage per cell Specify the minimum required percentage of the well trace to be covered by values, for the cell to be upscaled. For example, if the 'Minimum data coverage per cell' is set to 60%, this means that gaps in the log values (i.e. intervals where the log is non-existent, or 'undefined') are not allowed to exceed 40%; if the gap(s) exceed 40% of the well trace, the cell is excluded from upscaling. The resulting grid property for that cell will be 'undefined'. Right-click on 1, and you can switch between fraction and %.
Leave cells undefined where angle is smaller than By checking the box and filling in a threshold angle, you can define which parts of a (horizontal) well are excluded from upscaling: all cells within those sections will get the value 'undefined'. Threshold angle is the angle between the grid cell and the wellbore trajectory.
A weighted average is a type of mean that gives differing importance to the log values of the log being upscaled. Calculating the weighted average involves multiplying each data point by its weight and summing those products, then summing the weights of all data points and finally dividing the weight * value products by the sum of the weights. If the weights are all the same then the result is the same as an unweighted average.
A weighted arithmetic average of x, for example, is:

x = log value of log being upscaled
weight = log value of the 'weight by' log
Select one of the three options on how undefined and zero values in the 'weight by' log should be handled:
Random selection Move the slider to change the percentage.
Seed The seed number determines the starting point of the data sampling. You have two options:
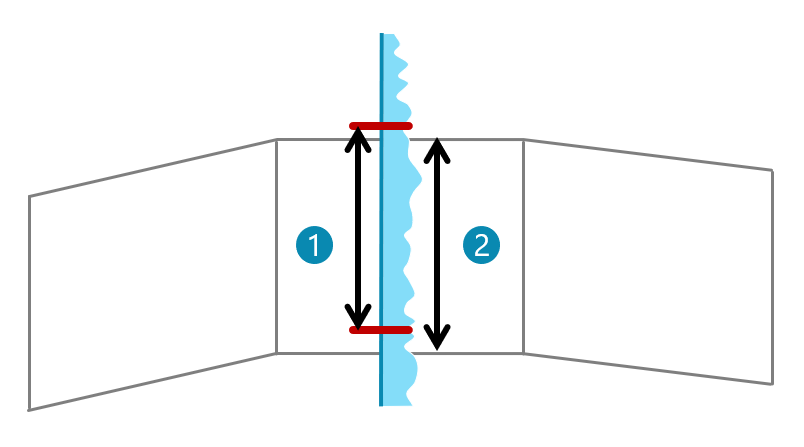
Depth alignment options: (1) Marker depth alignment, (2) Grid depth alignment. click to enlarge
Note: If not already present, the process of well log upscaling creates blocked wells immediately after the upscaled property is created. The blocked wells are located under the 3D Grid in the JewelExplorer. For more information see Blocked well.